Visual record
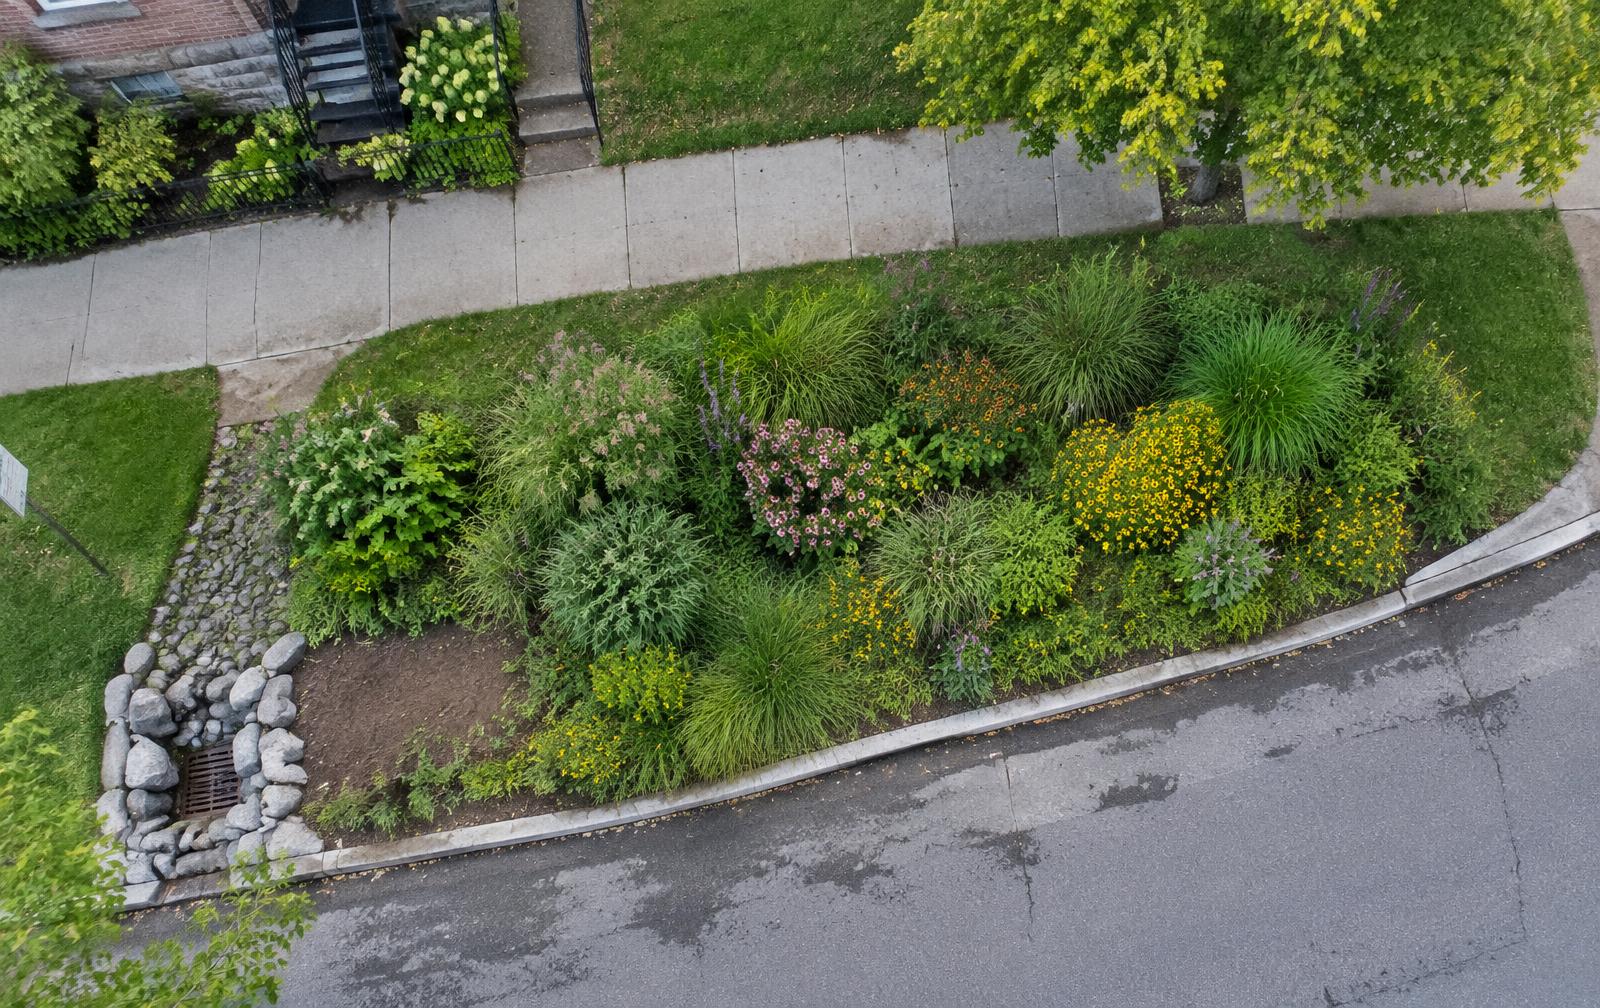
Drone surveys and field observations create a repeatable baseline for tracking how the site changes.
- 6,525.9
- Site area · ft²
- 528.8
- Elevated canopy · ft²
- 8.10%
- Canopy cover
- 11 trees were documented in the field and connected to the mapped rain garden record.
- About 97% of the detected elevated canopy was linked to mapped crown areas from the field inventory.
- Repeat drone views can help compare future conditions after storms, maintenance, planting or tree loss.
97.02% linkage for detected canopy above 6.6 ft. A strong connection between ground records and measurements from above.
Park Triangle Final Vegetation and Drone Survey Report
Community perspective
Awareness, appearance and reported experience.
- Reviewed
Appearance + maintenance
Community feedback
Community concern
Some residents are concerned that rain gardens can look unkempt without visible stewardship.
- Reviewed
Who is responsible?
Community feedback
Awareness gap
Some residents are not familiar with UpstreamPGH or who maintains the site.
- Reviewed
Flooding experience
Community feedback
Reported community outcome
A nearby church reports fewer basement flooding events since the upstream rain garden was installed.
Reported experience, not verified causation or drone evidence.
On-site QR record
Residents scan this sign to see the record and add what they notice.
Open public recordPeople + Work
Students are helping build the project record and the community connection.
- 6
- students in field collection
- 35
- field records across Park Triangle
- 11
- rain garden tree records
5 active collection weeks · Most fieldwork by teenagers approximately 14–18
Field + drone survey
Completed6 students · Field observation + Visual data collection
Students used structured observation forms and tagged vegetation records alongside repeated drone surveys.
Nature trail
CompletedNature trail / interpretation
Green Jobs Lab students built a nature trail around the rain garden.
Community outreach
PlannedCommunity engagement
Students will introduce the rain garden, invite neighbors to use the QR record, and help generate ongoing feedback. Paid community outreach roles are planned.
What may need attention
Build community familiarity
Residents need a clearer understanding of what the rain garden does and who is responsible for it.
Make stewardship visible
Appearance concerns can be easier to address when residents can see recent care, monitoring and who is involved.
Gather feedback before the next installation
A second rain garden is proposed nearby. Use outreach and the QR record to understand concerns and questions before deployment.
Frontline is exploring how visual data collection, field observation, community engagement and stewardship can become recurring paid work and career pathways.
Stay close to what we're learning.
Get new project examples, field insights, and opportunities to test Responsive Cities with your community or infrastructure project.